




Mapping Mosquito-Borne Disease with Smarter GIS Automation
In Brief
Turning Mosquito Test Results into Actionable Maps
Harris County Public Health in Texas regularly tests mosquitoes for diseases that can pose a risk to residents, but turning those results into geographic information required staff to manually process data and create maps for analysis and public communication.
Resource Data developed an automated GIS solution that transforms new test results into spatial data and powers an interactive map showing mosquito-borne disease activity and treatment areas across the county, giving staff and residents faster access to current public health information.
Key Takeaways
From Test Results to Timely Public Information
-
Automating Mosquito Surveillance Mapping
Resource Data helped Harris County Public Health turn ongoing mosquito test results into automatically updated GIS data and interactive public maps.
-
Mapping Disease Activity Without Pinpointing Test Locations
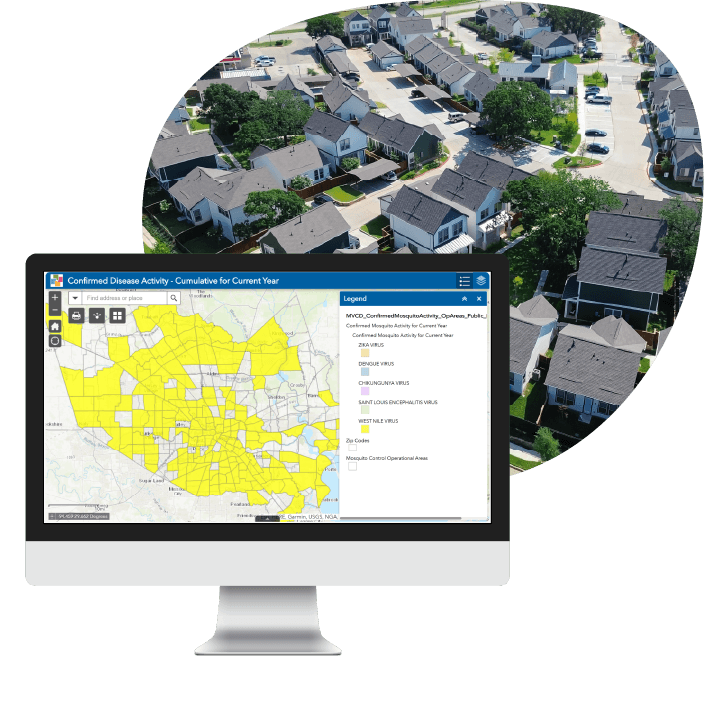
Positive results are connected to county-defined mosquito-control areas, giving residents useful geographic context without exposing exact trap locations.
-
Connecting Disease Activity and Treatment Information
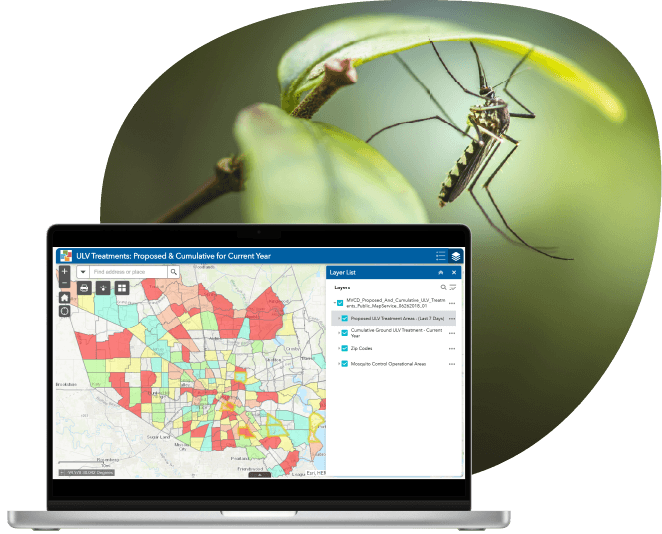
Interactive maps make it easier to see confirmed mosquito-borne disease activity alongside recent and cumulative mosquito-control treatments.
-
Building a Foundation for Ongoing Public Awareness
The GIS approach established a sustainable way to keep changing mosquito activity and treatment information accessible to the public.

Meet Our Client
Harris County Public Health
Harris County Public Health serves communities across Harris County, Texas, through programs focused on protecting and improving public health. Its Mosquito & Vector Control Division monitors mosquito populations and mosquito-borne diseases to help reduce the risk of transmission to residents.
As part of that work, teams collect mosquitoes from traps located throughout the county and test samples for diseases including West Nile virus, St. Louis encephalitis, chikungunya, dengue, and Zika. The results help the division understand where disease activity is occurring and support mosquito control and public education efforts.

The Challenge
A Manual Process Behind Every Map Update
Mosquito test results arrived as spreadsheets with tabular data, leaving Harris County Public Health with several steps before that information could be used geographically. Staff had to bring the data into GIS, identify positive results, convert them into spatial features, and create or update maps as new results became available.
The division also needed to communicate mosquito activity and treatment information to the public without displaying the exact locations of positive tests. The challenge was not simply creating a map but finding a more efficient way to turn ongoing surveillance data into useful geographic information that could support both Public Health staff and residents.
The Solution
Automating the Path from Spreadsheet to Map
Resource Data developed Texas History Navigator as a mobile experience built around where users are and where they want to go. The app connects THC’s historical information with geolocation and an ArcGIS Online interactive map, allowing residents and visitors to search thousands of historical markers, museums, and heritage sites, see what is nearby, and learn more as they travel.
As THC looked for new ways to encourage exploration, the app expanded beyond location-based discovery. Resource Data added user accounts, check-ins, points, levels, and badges that let users track the places they visit and progress as they explore more of the state. Plan My Trip also allows users to select multiple destinations, arrange their stops, and continue the route in Google Maps or Apple Maps.


We were able to take tabular mosquito test results, connect them to Harris County’s operational areas, and automate everything needed to turn that data into information the public could use.
- Dave Saleh, GIS Lead, Resource Data
Features
Built to Keep Disease and Treatment Data Current
-
Automated Data Processing for Up-to-Date Maps
Python scripts process new test spreadsheets, identify positive results and their locations, update the corresponding GIS features, and publish the data to the web map automatically.
-
County-Defined Areas for Clearer Disease Mapping
Positive tests are mapped to Harris County’s established mosquito-control areas instead of exact trap locations, providing geographic context while protecting location privacy.
-
Disease-Specific Layers for Confirmed Activity
Map layers show the general areas where mosquito-borne disease activity has been confirmed and distinguish the disease detected.
-
Recent Treatment Mapping for Current Information
Treatment areas remain highlighted for seven days, giving users a clear view of recent mosquito-control activity.
-
Cumulative Treatment History for Long-Term Context
Color-coded areas show how many times an area has been treated during the year, making treatment patterns easier to understand.

Results
Making Mosquito Activity Easier to See and Understand
The interactive maps gave residents a more accessible way to understand where mosquito-borne disease activity had been identified and where mosquito-control treatments were taking place across Harris County. Instead of relying on static information, users could explore current activity geographically and see how it is related to their area.
Live maps remain part of Harris County’s mosquito-control resources today, providing current information on confirmed disease activity and treatment areas.

What's Next
A Foundation for Ongoing Public Health Mapping
Mosquito surveillance does not stop with a single season. By connecting ongoing test data with GIS and public-facing maps, Harris County established a foundation for keeping mosquito activity and treatment information accessible as conditions change.